Prometheus 是 Kubernetes 中默认的监控方案,它专注于告警和收集存储最近的监控指标。但在一定的集群规模下,Prometheus 也暴露出一些问题。例如:如何以经济可靠的方式存储 PB 级别的历史数据,并且不牺牲查询时间?如何通过单一的查询接口访问到不同 Prometheus 服务器上的所有指标数据?能否以某种方式合并采集到的重复数据?针对以上的这些问题, Thanos 提供了高可用的的解决方案,并且它有着不受限制的数据存储能力。
Thanos
Thanos 基于 Prometheus。当我们以不同方式使用 Thanos 时,或多或少都会用到 Prometheus 功能,但是 Prometheus 始终是指标收集和使用本地数据进行预警功能的基础。
Thanos 使用 Prometheus 存储格式,把历史数据以相对高性价比的方式保存在对象存储里,同时兼有较快的查询速度。此外,它还能对你所有的 Prometheus 提供全局查询视图。
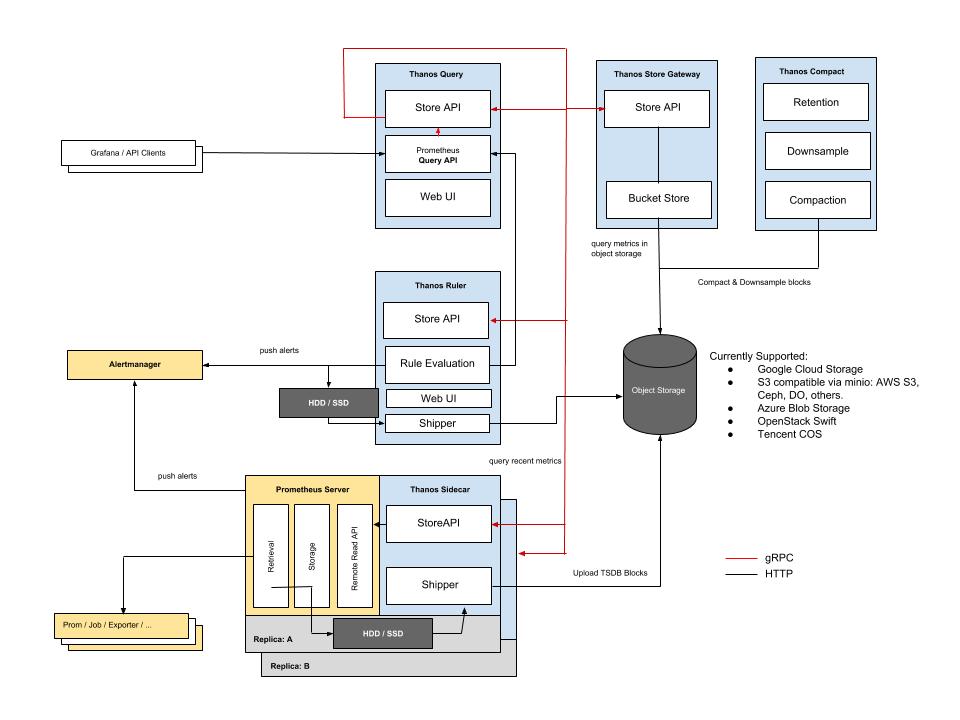
依据 KISS 原则和 Unix 哲学,Thanos 划分如下特定功能的组件。
- 边车组件(Sidecar):连接Prometheus,并把Prometheus暴露给查询网关(Querier/Query),以供实时查询,并且可以上传Prometheus数据给云存储,以供长期保存;
- 查询网关(Querier/Query):实现了Prometheus API,与汇集底层组件(如边车组件Sidecar,或是存储网关Store Gateway)的数据;
- 存储网关(Store Gateway):将云存储中的数据内容暴露出来;
- 压缩器(Compactor):将云存储中的数据进行压缩和下采样;
- 接收器(Receiver):从Prometheus’ remote-write WAL(Prometheus远程预写式日志)获取数据,暴露出去或者上传到云存储;
- 规则组件(Ruler):针对数据进行评估和报警;
组件之间的关系如图:
部署
在 K8S 集群中部署 Prometheus 最简单的方法是用 helm 安装 prometheus-operator。更多关于 Prometheus-operator 的内容请阅读《Prometheus-operator 介绍和配置解析 》。Prometheus-Operator 提供了高可用的支持,Thanos 边车组件(Sidecar)的注入,以及监控服务器、监控 Kubernetes 基础组件,可以监控应用所需的预制报警。
Choerodon 提供的 Prometheus-opertor 在社区版的基础上添加多集群监控的仪表盘。
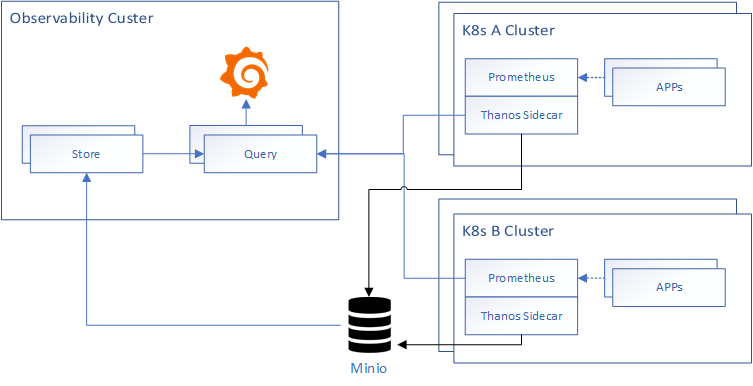
本篇文章部署架构图如下所示:
对象存储
目前 thanos 支持大部分云厂商的对象存储服务,具体使用请参考thanos 对象存储。本文使用 minio 代替 S3 对象存储。为了方便将 minio 安装在 Observability 集群。
编写 minio 参数配置文件minio.yaml:
mode: distributed
accessKey: "AKIAIOSFODNN7EXAMPLE"
secretKey: "wJalrXUtnFEMI/K7MDENG/bPxRfiCYEXAMPLEKEY"
persistence:
    enabled: true
    storageClass: nfs-provisioner
ingress:
    enabled: true
    path: /
    hosts:
    - minio.example.choerodon.io
执行安装命令:
helm install c7n/minio \
    -f minio.yaml \
    --version 5.0.4 \
    --name minio \
    --namespace monitoring
登录 minio 创建一个 thanos 桶。
在每个集群中都创建一个存储secret。
配置文件
thanos-storage-minio.yaml。type: s3
config:
bucket: thanos
endpoint: minio.example.choerodon.io
access_key: AKIAIOSFODNN7EXAMPLE
secret_key: wJalrXUtnFEMI/K7MDENG/bPxRfiCYEXAMPLEKEY
insecure: true
signature_version2: false创建存储的 secret:
kubectl -n monitoring create secret generic thanos-objectstorage --from-file=thanos.yaml=thanos-storage-minio.yaml
Observability 集群安装 Promethues-operator
在 Observability 集群中安装的 Promethues-operator 需要安装 grafana 并且修改默认的 datasource 为 Thanos 的 Query 组件。Observability-prometheus-operator.yaml 配置文件如下:
grafana:
  persistence:
    enabled: true
    storageClassName: nfs-provisioner
  ingress:
    enabled: true
    hosts:
    - grafana.example.choerodon.io
  additionalDataSources:
    - name: Prometheus
      type: prometheus
      url: http://thanos-querier:9090/
      access: proxy
      isDefault: true
  sidecar:
    datasources:
      defaultDatasourceEnabled: false
prometheus:
  retention: 12h
  prometheusSpec:
    externalLabels:
      cluster: observe # 添加 cluster 标签区分集群
    storageSpec:
      volumeClaimTemplate:
        spec:
          storageClassName: nfs-provisioner
          resources:
            requests:
              storage: 10Gi
    thanos:
      baseImage: quay.io/thanos/thanos
      version: v0.10.1
      objectStorageConfig:
        key: thanos.yaml
        name: thanos-objectstorage
安装 prometheus-operator 集群
helm install c7n/prometheus-operator \
    -f Observability-prometheus-operator.yaml \
    --name prometheus-operator \
    --version 8.5.8 \
    --namespace monitoring
A\B 集群安装 Promethues-operator
A\B 集群中就只需要安装 prometheus 相关的组件,grafana、alertmanager 等组件不再需要安装,配置文件proemtheus-operator.yaml 如下:
alertmanager:
  enabled: false

grafana:
  enabled: false

prometheus:
  retention: 12h
  prometheusSpec:
    externalLabels:
      cluster: a-cluster # 添加 cluster 标签区分集群
    storageSpec:
      volumeClaimTemplate:
        spec:
          storageClassName: nfs-provisioner
          resources:
            requests:
              storage: 10Gi
    thanos:
      baseImage: quay.io/thanos/thanos
      version: v0.10.1
      objectStorageConfig:
        key: thanos.yaml
        name: thanos-objectstorage
安装 prometheus-operator 集群
helm install c7n/prometheus-operator \
    -f prometheus-operator.yaml \
    --name prometheus-operator \
    --version 8.5.8 \
    --namespace monitoring
为 Thanos SideCar 创建子域名分别指向集群A/B
thanos-a.example.choerodon.io
thanos-b.example.choerodon.io
以 A 集群为例创建 ingress 规则
apiVersion: v1
kind: Service
metadata:
  labels:
    app: prometheus
  name: thanos-sidecar-a
spec:
  ports:
    - port: 10901
      protocol: TCP
      targetPort: grpc
      name: grpc
      nodePort: 30901
  selector:
    statefulset.kubernetes.io/pod-name: prometheus-prometheus-operator-prometheus-0
  type: NodePort
---
apiVersion: extensions/v1beta1
kind: Ingress
metadata:
  annotations:
    nginx.ingress.kubernetes.io/ssl-redirect: "true"
    nginx.ingress.kubernetes.io/backend-protocol: "GRPC"
  labels:
    app: prometheus
  name: thanos-sidecar-0
spec:
  rules:
  - host: thanos-a.example.choerodon.io
    http:
      paths:
      - backend:
          serviceName: thanos-sidecar-a
          servicePort: grpc
Observability 集群安装 thanos
使用 kube-thanos 安装 Thanos。
安装需要的软件工具:
$ yum install -y golang
$ go get github.com/jsonnet-bundler/jsonnet-bundler/cmd/jb
$ go get github.com/brancz/gojsontoyaml
$ go get github.com/google/go-jsonnet/cmd/jsonnet
使用 jsonnet-bundler 安装 kube-thanos
$ mkdir my-kube-thanos; cd my-kube-thanos
$ jb init  # Creates the initial/empty `jsonnetfile.json`
# Install the kube-thanos dependency
$ jb install github.com/thanos-io/kube-thanos/jsonnet/kube-thanos@master # Creates `vendor/` & `jsonnetfile.lock.json`, and fills in `jsonnetfile.json`
更新 kube-thanos 依赖
$ jb update
创建 example.jsonnet
local k = import 'ksonnet/ksonnet.beta.4/k.libsonnet';
local sts = k.apps.v1.statefulSet;
local deployment = k.apps.v1.deployment;
local t = (import 'kube-thanos/thanos.libsonnet');

local commonConfig = {
  config+:: {
    local cfg = self,
    namespace: 'monitoring',
    version: 'v0.10.1',
    image: 'quay.io/thanos/thanos:' + cfg.version,
    objectStorageConfig: {
      name: 'thanos-objectstorage',
      key: 'thanos.yaml',
    },
    volumeClaimTemplate: {
      spec: {
        accessModes: ['ReadWriteOnce'],
        storageClassName: ''
        resources: {
          requests: {
            storage: '10Gi',
          },
        },
      },
    },
  },
};

local s = t.store + t.store.withVolumeClaimTemplate + t.store.withServiceMonitor + commonConfig + {
  config+:: {
    name: 'thanos-store',
    replicas: 1,
  },
};

local q = t.query + t.query.withServiceMonitor + commonConfig + {
  config+:: {
    name: 'thanos-query',
    replicas: 1,
    stores: [
      'dnssrv+_grpc._tcp.%s.%s.svc.cluster.local' % [service.metadata.name, service.metadata.namespace]
      for service in [s.service]
    ],
    replicaLabels: ['prometheus_replica', 'rule_replica'],
  },
};


{ ['thanos-store-' + name]: s[name] for name in std.objectFields(s) } +
{ ['thanos-query-' + name]: q[name] for name in std.objectFields(q) }
创建 build.sh
#!/usr/bin/env bash

# This script uses arg $1 (name of *.jsonnet file to use) to generate the manifests/*.yaml files.

set -e
set -x
# only exit with zero if all commands of the pipeline exit successfully
set -o pipefail

# Make sure to start with a clean 'manifests' dir
rm -rf manifests
mkdir manifests

# optional, but we would like to generate yaml, not json
jsonnet -J vendor -m manifests "${1-example.jsonnet}" | xargs -I{} sh -c 'cat {} | gojsontoyaml > {}.yaml; rm -f {}' -- {}

# The following script generates all components, mostly used for testing

rm -rf examples/all/manifests
mkdir -p examples/all/manifests

jsonnet -J vendor -m examples/all/manifests "${1-all.jsonnet}" | xargs -I{} sh -c 'cat {} | gojsontoyaml > {}.yaml; rm -f {}' -- {}
执行以下命令创建 K8S 资源文件
$ ./build.sh example.jsonnet
对于生成的资源文件有两处需要修改
$ vim manifests/thanos-store-statefulSet.yaml
------------------------------------------------------
    spec:
      containers:
      - args:
        - store
        - --data-dir=/var/thanos/store
        - --grpc-address=0.0.0.0:10901
        - --http-address=0.0.0.0:10902
        - --objstore.config=$(OBJSTORE_CONFIG)
        # - --experimental.enable-index-header # 注释掉这多余的一行
        env:

$ vim manifests/thanos-query-deployment.yaml
------------------------------------------------------
      containers:
      - args:
        - query
        - --grpc-address=0.0.0.0:10901
        - --http-address=0.0.0.0:9090
        - --query.replica-label=prometheus_replica
        - --query.replica-label=rule_replica
        - --store=dnssrv+_grpc._tcp.thanos-store.monitoring.svc.cluster.local
        # 添加本集群和 A/B 集群的 Store API
        - --store=dnssrv+_grpc._tcp.prometheus-operated.monitoring.svc.cluster.local
        - --store=dns+thanos-a.example.choerodon.io:30901
        - --store=dns+thanos-b.example.choerodon.io:30901
创建 Thanos
$ kubectl create -f manifests/
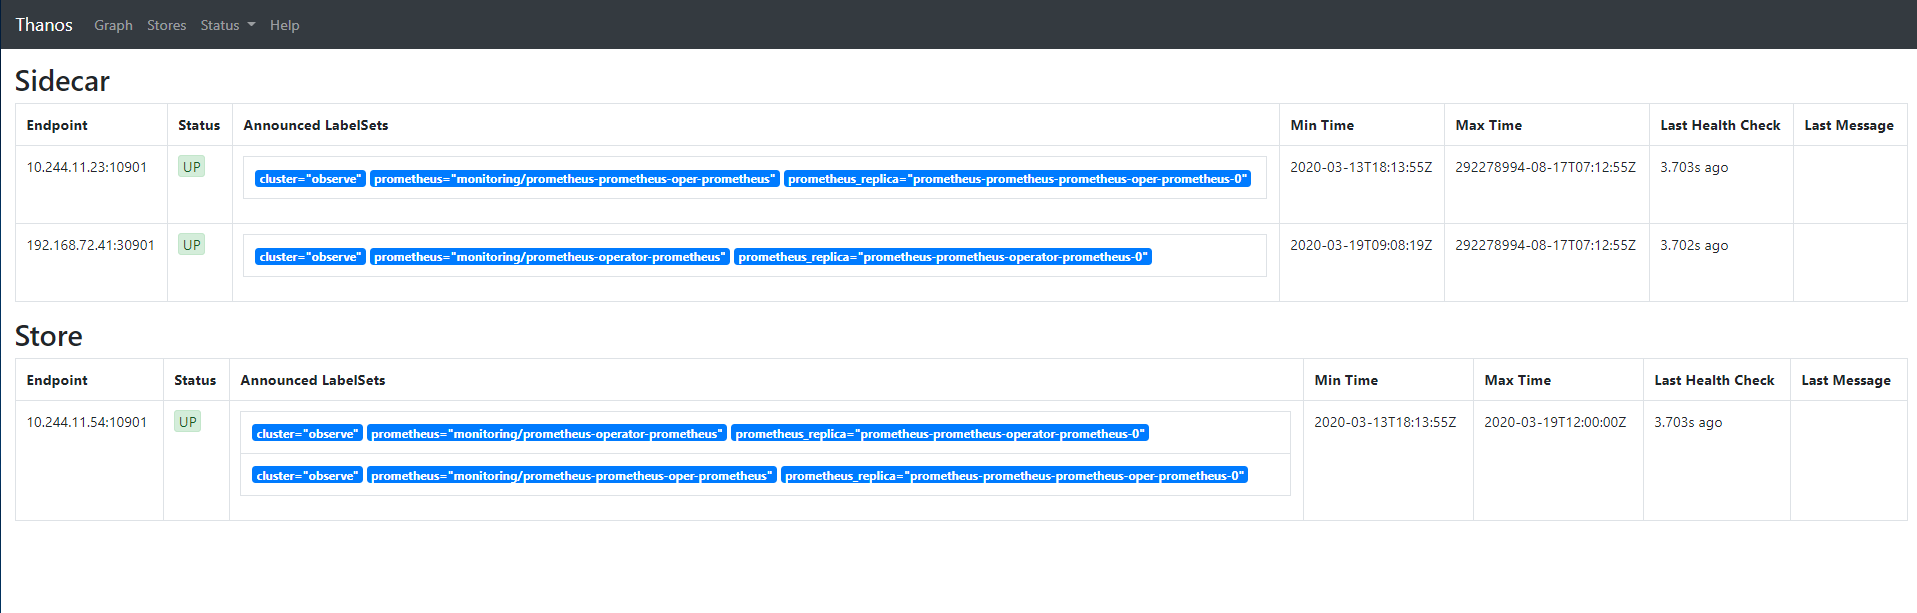
通过端口转发查看 Thanos Query 是否正常
$ kubectl port-forward svc/thanos-query 9090:9090 -n monitoring
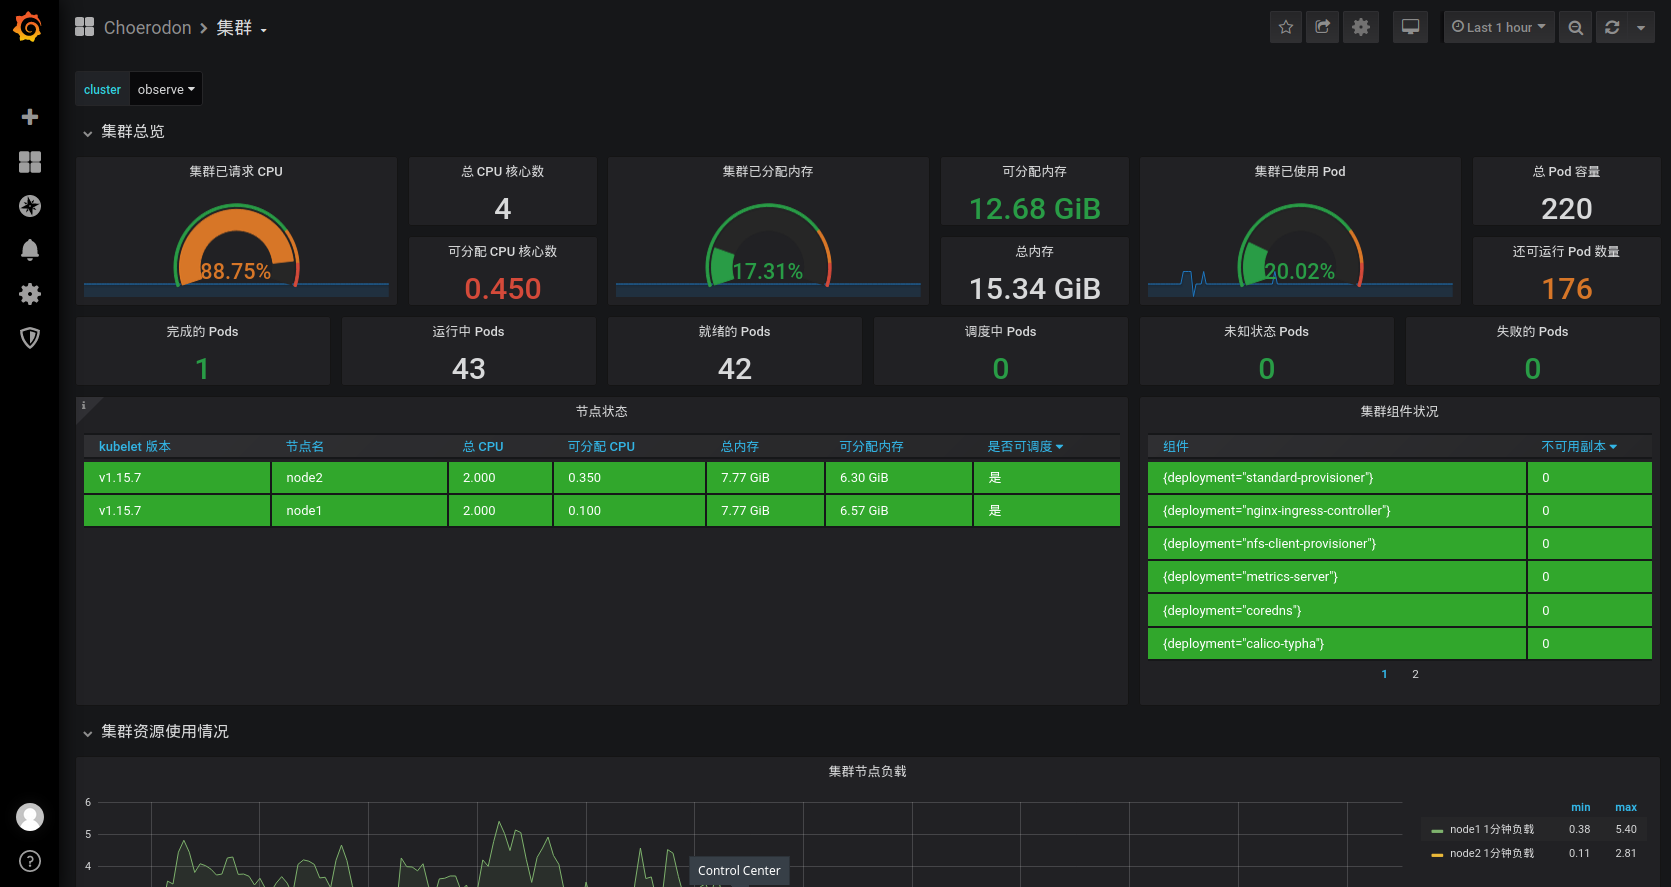
现在访问 http://grafana.example.choerodon.io 就可以查看多集群的监控信息。
总结
通过以上步骤就完成了使用 Thanos 的 Prometheus 多集群监控的安装,该方案具有长期存储的功能,并且可以查看跨集群的监控信息。
关于猪齿鱼
Choerodon 猪齿鱼作为全场景效能平台,是基于Kubernetes,Istio,knative,Gitlab,Spring Cloud来实现本地和云端环境的集成,实现企业多云/混合云应用环境的一致性。平台通过提供精益敏捷、持续交付、容器环境、微服务、DevOps等能力来帮助组织团队来完成软件的生命周期管理,从而更快、更频繁地交付更稳定的软件。
Choerodon 猪齿鱼v0.21已经发布,欢迎大家前来安装/升级。
安装文档:http://choerodon.io/zh/docs/installation-configuration/steps/
升级文档:http://choerodon.io/zh/docs/installation-configuration/update/0.20-to-0.21/
更加详细的内容,请参阅Release Notes和官网。
大家也可以通过以下社区途径了解猪齿鱼的最新动态、产品特性,以及参与社区贡献:
欢迎加入Choerodon猪齿鱼社区,共同为企业数字化服务打造一个开放的生态平台。